Building a Yelp Hybrid Recommendation System with Spark MLlib (ALS + Random Forest)
📌TL;DR
Built an end-to-end hybrid recommendation system on a 1,000,000 review sample from the Yelp Open Dataset using Spark on AWS. The baseline collaborative filtering model (ALS) achieved test RMSE = 1.5548 after clipping predictions to 1-5 stars. Then built a hybrid RandomForestRegressor that stacks the ALS prediction with side features including TF-IDF text embeddings (500 dimensions), business categories (top 50), user average rating, and sentiment scores. The hybrid model improved performance to test RMSE = 1.4292 and test MAE = 1.0465, representing an 8% RMSE improvement and 16% MAE improvement over the baseline. Applied iterative 2-core filtering to reduce sparsity, processed the data through three notebooks (EDA, preprocessing, modeling), and stored results in Parquet on S3 with Athena for fast querying. Feature importance analysis showed ALS prediction dominated at 77%, followed by user average stars at 12%, sentiment at 5%, and text features at 5%.
Introduction
Recommendation systems are everywhere in modern applications, from suggesting movies on Netflix to recommending restaurants on Yelp. Given a user and a business, can we predict the Yelp star rating (1 to 5)? This is a classic recommender problem with two competing approaches:
- Collaborative filtering learns user-item interaction patterns well, but struggles with sparsity and cold-start problems
- Content and context features (text, categories, user history) add valuable signal, but can be high-dimensional and expensive at scale
The solution? A hybrid approach that combines the best of both worlds: ALS for interaction structure + side features for extra context.
What I Built
An end-to-end hybrid recommendation pipeline that:
- Processes 1 million Yelp reviews using Spark on AWS
- Applies iterative 2-core filtering to reduce sparsity
- Engineers 553 features combining ALS predictions, TF-IDF text, categories, user stats, and sentiment
- Trains and evaluates both baseline ALS and hybrid Random Forest models
- Stores processed data in Parquet on S3 with Athena for fast queries
The complete pipeline walks through: EDA → preprocessing → feature engineering → modeling → evaluation → insights.
Dataset Overview
I used a Yelp reviews sample with:
- 1,000,000 reviews
- ~558,000 users
- ~127,000 businesses
Key columns include: review_id, user_id, business_id, stars, text, date, and business categories. The data spans reviews from 2005 to 2022, providing a rich dataset for building recommendation models.
Project Architecture
I organized the workflow into three notebooks:
01_eda_sagemaker.ipynb: Exploratory data analysis and visualizations02_preprocessing_sagemaker.ipynb: Filtering, feature engineering, Parquet export03_modeling_sagemaker.ipynb: ALS baseline, hybrid RF, evaluation
Full pipeline design:
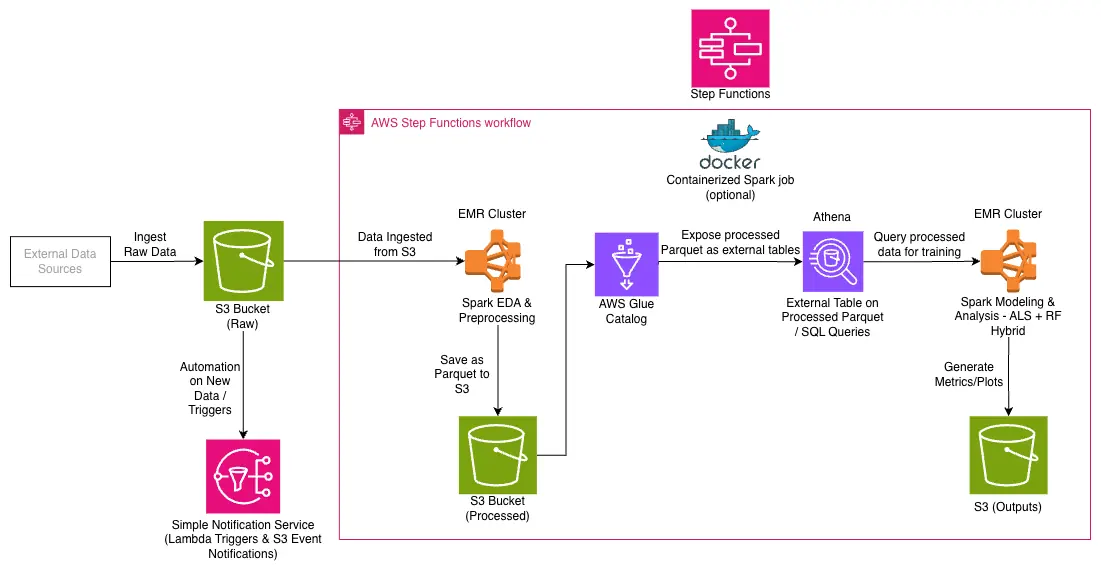
Figure 1: Full pipeline design showing the complete workflow from raw data to model evaluation
High-level dataflow:
- S3 stores raw data and outputs
- Spark runs EDA, preprocessing, and model training
- Processed Parquet is written back to S3
- Athena queries processed Parquet for fast inspection
- MLlib models train and evaluate on the processed dataset
- Metrics and plots are saved as artifacts
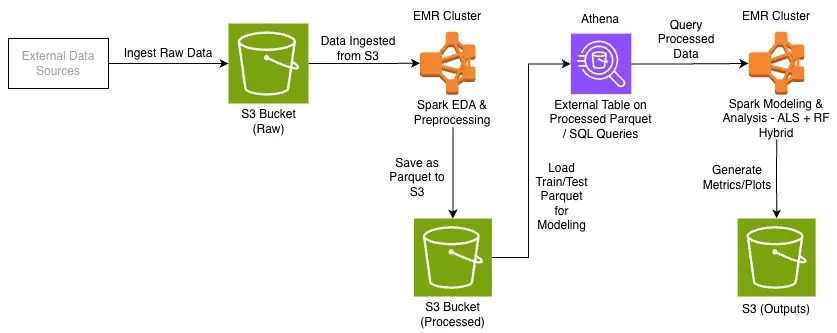
Figure 2: Implemented dataflow architecture (S3 → Spark → Parquet → Athena → ML + artifacts)
This architecture provides a scalable pipeline that can handle much larger datasets by simply increasing Spark cluster resources.
Part 1: Exploratory Data Analysis (EDA)
EDA revealed several key challenges that would shape the modeling approach.
1. Ratings are heavily skewed positive
The rating distribution in the 1M review sample shows a strong positive bias:
- 1 star: 152,673 (15%)
- 2 star: 77,524 (8%)
- 3 star: 99,274 (10%)
- 4 star: 207,711 (21%)
- 5 star: 462,818 (46%)
About 46% of all reviews are 5-star reviews, creating a significant class imbalance that models must handle.
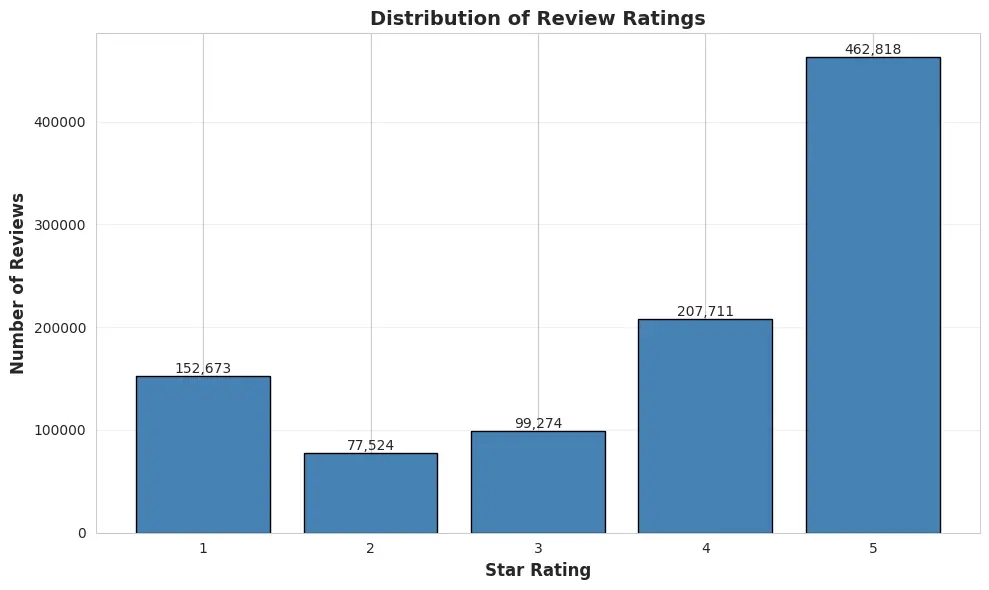
Figure 3: Distribution of review ratings (1-5 stars) showing strong positive bias
2. Long-tailed user activity and business popularity
User activity is extremely skewed, creating sparsity challenges:
- User review count range: 0 to 17,473
- Average user reviews: 40.6
- Users with more than 5 reviews: 365,168 (65.5%)
This long tail creates sparsity in the user-business interaction matrix, which is exactly where ALS collaborative filtering tends to struggle.
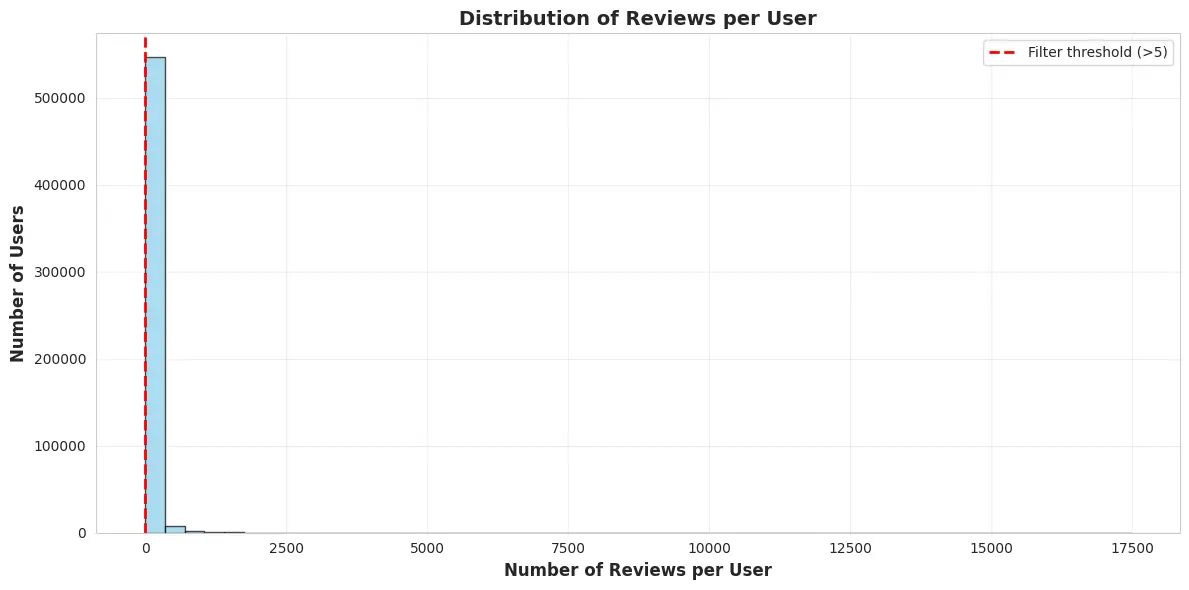
Figure 4: Distribution of reviews per user showing long-tail pattern
3. Lower ratings tend to have longer text
Average review text length decreases as rating increases:
- 1 star: 863.0 characters
- 2 star: 775.0 characters
- 3 star: 675.0 characters
- 4 star: 552.0 characters
- 5 star: 448.1 characters
This pattern suggests that text contains real signal: negative reviews are often more detailed and verbose, providing rich content for text-based features.
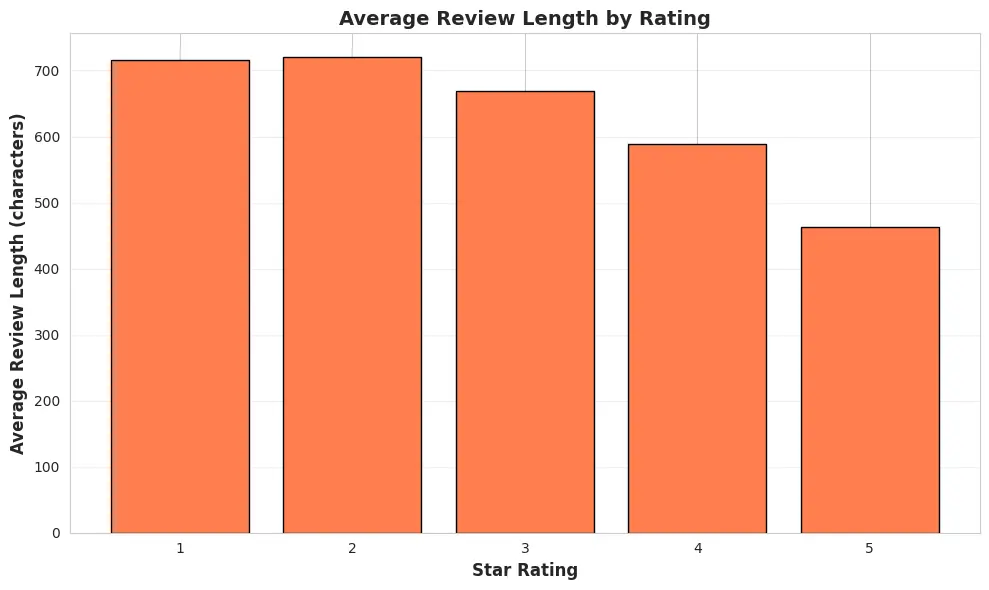
Figure 5: Average review text length by rating (lower ratings have longer text)
4. Correlations: user and business averages dominate
The strongest correlations with stars were:
user_average_stars: 0.580business_average_stars: 0.486
Votes like useful, funny, cool were much weaker predictors:
- useful: 0.070
- funny: 0.025
- cool: 0.047
This insight guided feature engineering, prioritizing user and business history over social voting signals.
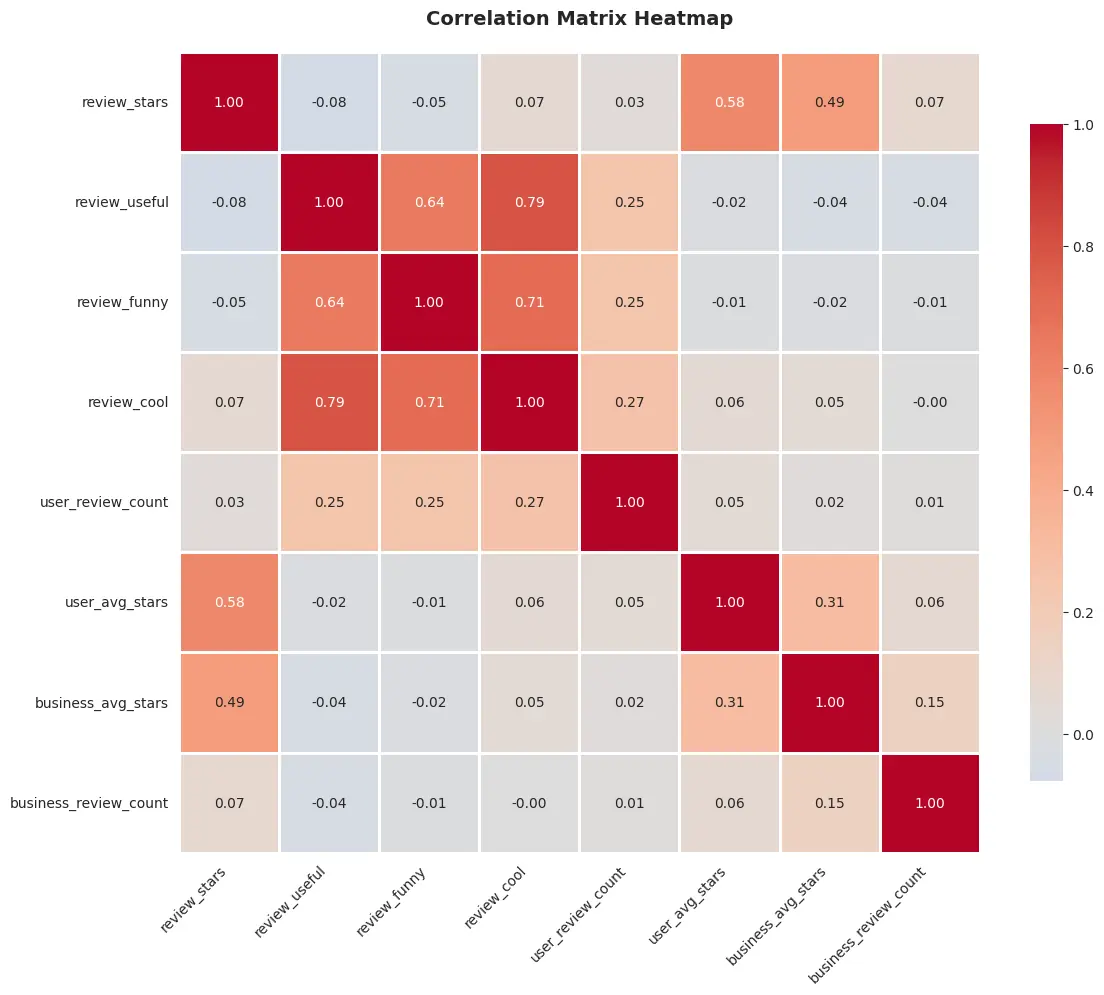
Figure 6: Correlation heatmap showing user and business averages as strongest predictors
5. Time trends and seasonality
Review volume increased significantly over time (2005-2022), with notable seasonal patterns. These trends can be valuable for time-aware recommenders in future extensions.
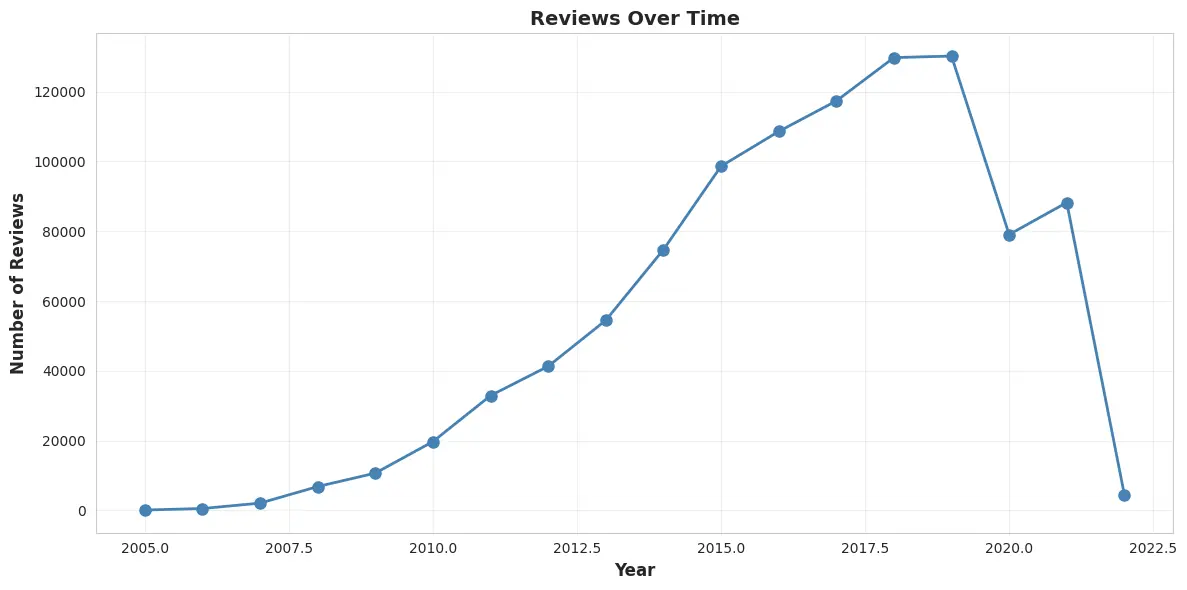
Figure 7: Number of reviews over time (2005-2022) showing growth trend
Part 2: Preprocessing and Feature Engineering
Preprocessing had two main goals:
- Reduce sparsity so collaborative filtering has enough signal
- Create scalable side features for a hybrid model
Step 1: Filter for active users and businesses
I filtered the raw 1,000,000 reviews to keep:
- Users with more than 3 reviews
- Businesses with more than 5 reviews
This reduced the interaction matrix to a denser subset before applying deeper filtering.
Step 2: Iterative 2-core filtering (k-core)
Even after activity filters, some users or businesses become isolated after removing others. I applied an iterative 2-core filter over the bipartite interaction graph:
- Every remaining user appears in at least 2 reviews
- Every remaining business appears in at least 2 reviews
This converged after 5 iterations, yielding:
- 530,885 reviews
- 125,796 users
- 62,905 businesses
Step 3: Remove extreme outliers with a 3-sigma rule
I removed extreme values (upper tail) for:
useful,funny,coolvote countstext_length
Computed statistics on the filtered set:
- useful: mean=1.45, std=3.33
- funny: mean=0.44, std=1.86
- cool: mean=0.73, std=2.59
- text_length: mean=618.70, std=547.57
After outlier removal: 511,827 reviews (cleaned)
Step 4: Engineer features for hybrid learning
I created several feature groups for the hybrid model:
A) Text TF-IDF (hashed, 500 dimensions)
Pipeline:
RegexTokenizer- tokenize review textStopWordsRemover- remove common wordsHashingTF(numFeatures=500)- hash to fixed sizeIDF- apply inverse document frequency weighting
This produces a fixed-size sparse vector per review, making it scalable for large datasets.
B) Business categories (top 50)
Each business has a category string (comma-separated). I:
- Split into an array
- Fit a
CountVectorizer(vocabSize=50, minDF=2.0) - Transformed to a sparse vector
This is effectively a multi-hot encoding over the most frequent categories.
C) User statistics
From the filtered review history:
user_avg_stars- user's historical average ratinguser_total_reviews- user's total review count
These are strong signals, as EDA showed user average correlates heavily with stars (0.580 correlation).
D) Sentiment score (simple lexicon-based)
I used a lightweight sentiment score:
- Tokenize the review text
- Count positive and negative word matches
- Compute:
sentiment = (pos - neg) / (pos + neg) - If no matches, sentiment = 0
This simple approach provides a quick sentiment signal without expensive deep learning models.
E) Temporal and length fields
I extracted:
year,month,hour,day_of_weektext_length
These capture temporal patterns and review verbosity.
Step 5: Build final ML-ready dataset
After ensuring all engineered vectors were present and valid:
- 511,820 reviews (about 51% of the original 1M)
Step 6: Train/test split and storage
I created an 80/20 split with a fixed seed:
- Train: 409,396 reviews
- Test: 102,424 reviews
- Average rating: 3.86 (train) vs 3.85 (test)
I saved both splits as Parquet to S3 (Snappy compression), then created an Athena external table to query the processed dataset.
Example Athena DDL:
CREATE EXTERNAL TABLE IF NOT EXISTS yelp_reviews_processed (
  review_id STRING,
  user_id STRING,
  business_id STRING,
  stars DOUBLE,
  useful BIGINT,
  funny BIGINT,
  cool BIGINT,
  text_length INT,
  year INT,
  month INT,
  hour INT,
  day_of_week INT,
  user_avg_stars DOUBLE,
  user_total_reviews BIGINT,
  sentiment FLOAT
)
STORED AS PARQUET
LOCATION 's3://<your-bucket>/yelp-data/processed/train/'
TBLPROPERTIES ('parquet.compression'='SNAPPY');
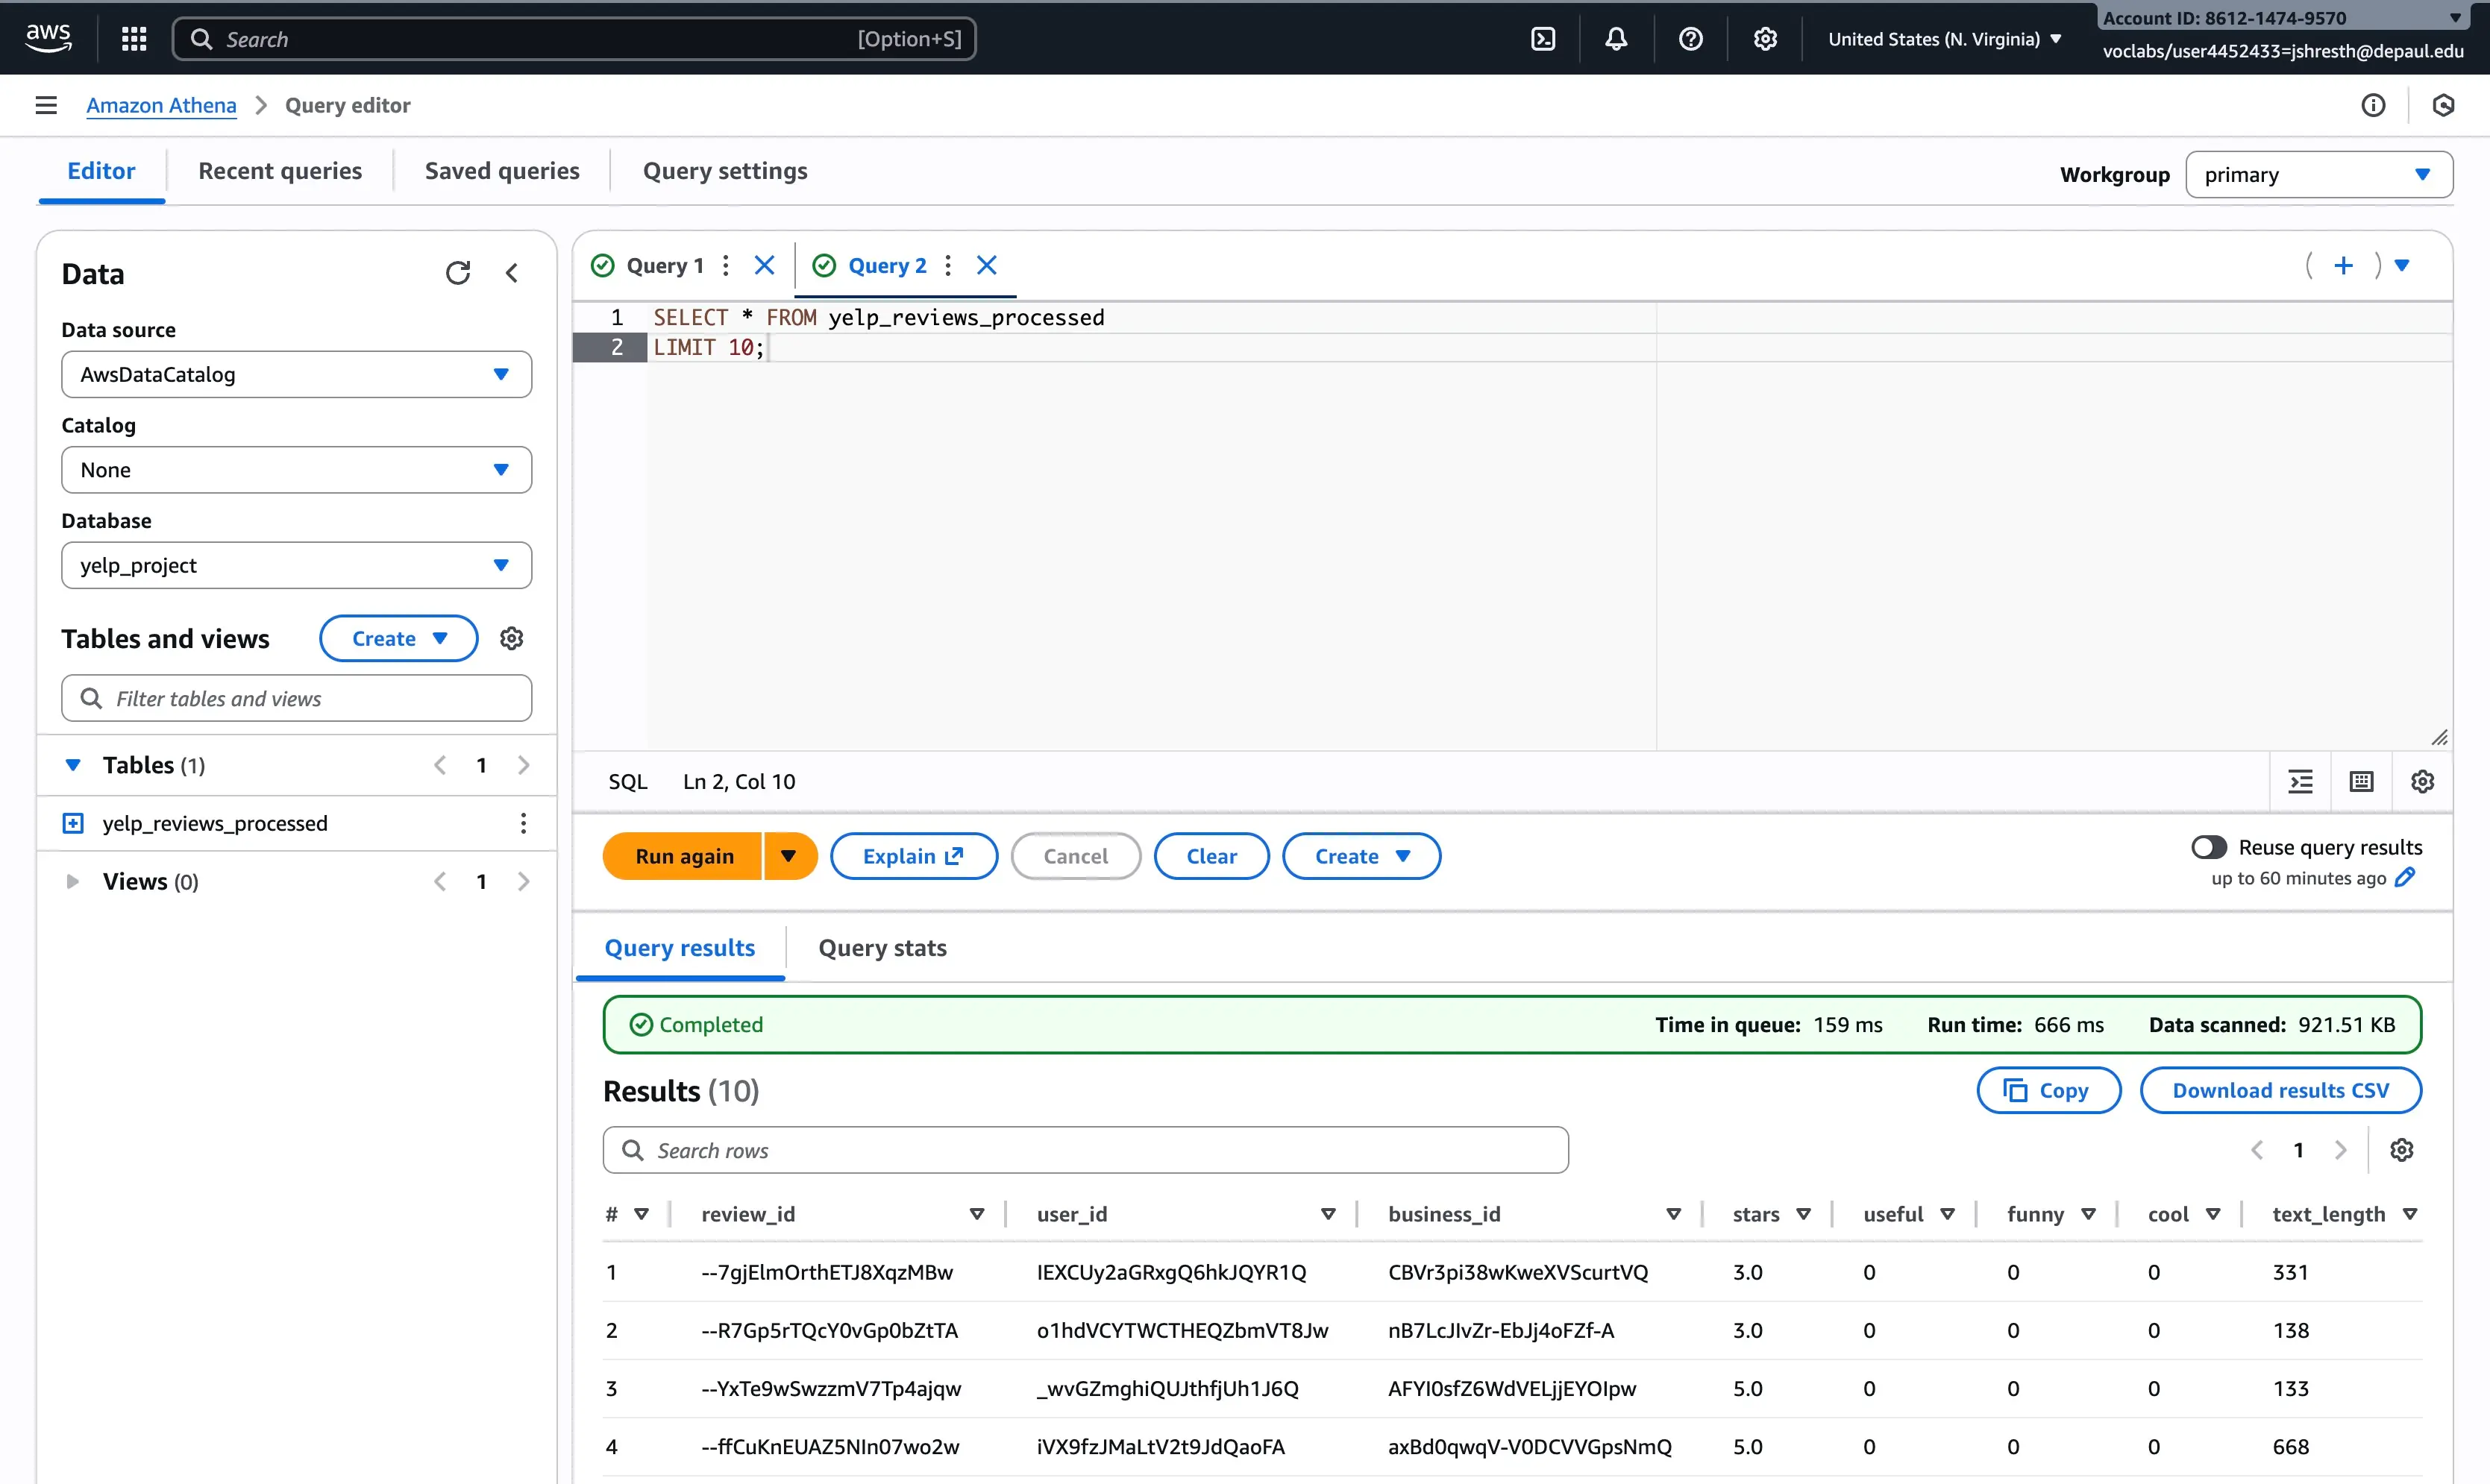
Figure 8: Athena external table setup for fast Parquet queries
Part 3: Modeling
I trained two models to compare collaborative filtering with a hybrid approach:
- ALS baseline (collaborative filtering)
- Hybrid Random Forest (ALS + side features)
Model 1: ALS Baseline (Spark MLlib)
ALS (Alternating Least Squares) learns latent vectors for users and businesses from interactions only, without using any side features.
1) Index user_id and business_id
ALS requires numeric user/item IDs, so I used StringIndexer:
- Unique users (post-filter): 131,105
- Unique businesses (post-filter): 65,470
2) Train ALS and tune hyperparameters
I ran a 2-fold CV grid search:
rank: [5, 10, 20]regParam: [0.01, 0.1, 0.5]maxIter: default 10nonnegative=TruecoldStartStrategy="drop"
Best parameters:
- rank=10
- regParam=0.5
3) Clip predictions to the rating scale
ALS can output values outside 1-5, so I clipped predictions into the valid range [1, 5].
4) Results
ALS baseline (tuned + clipped):
- Train RMSE: 0.7446
- Test RMSE: 1.5548
- Test MAE: 1.2522
- Test R²: -0.4447
The negative R² indicates the model is struggling relative to a naive baseline (predicting the mean). This is consistent with sparsity and rating skew challenges.
Extra: Top-K recommendations sanity check
I also generated top-10 recommendations for a sample user and computed Precision@10, which came out 0.0 in this setup.
This is expected because:
- The split is review-level (not leave-one-out ranking evaluation)
- ALS is being evaluated as a rating predictor, not optimized for ranking metrics
- Cold-start and dropped predictions reduce overlap
RMSE and MAE are the primary metrics for this project.
Model 2: Hybrid RandomForestRegressor (ALS + side features)
ALS captures interaction patterns, but it ignores rich context like review text and business categories. I trained a second-stage model that uses:
- ALS prediction (clipped) - 1 feature
- TF-IDF text vector - 500 features
- Category vector - 50 features
- user_avg_stars - 1 feature
- sentiment - 1 feature
Total feature vector size: 1 + 500 + 50 + 1 + 1 = 553 features
1) Hyperparameter selection (practical constraints)
Random forests can be expensive at this scale, so I selected hyperparameters from a manual search using a 30% training sample (to keep training tractable).
Final choice:
- numTrees = 80
- maxDepth = 10
2) Results (final tuned hybrid)
Hybrid RF (80 trees, depth 10):
- Train RMSE: 0.4477
- Test RMSE: 1.4292
- Test MAE: 1.0465
- Test R²: -0.2207
Compared to ALS:
- RMSE improved by about 8% (from 1.5548 to 1.4292)
- MAE improved by about 16% (from 1.2522 to 1.0465)
The hybrid model clearly helps, demonstrating the value of combining collaborative filtering with content and context features.
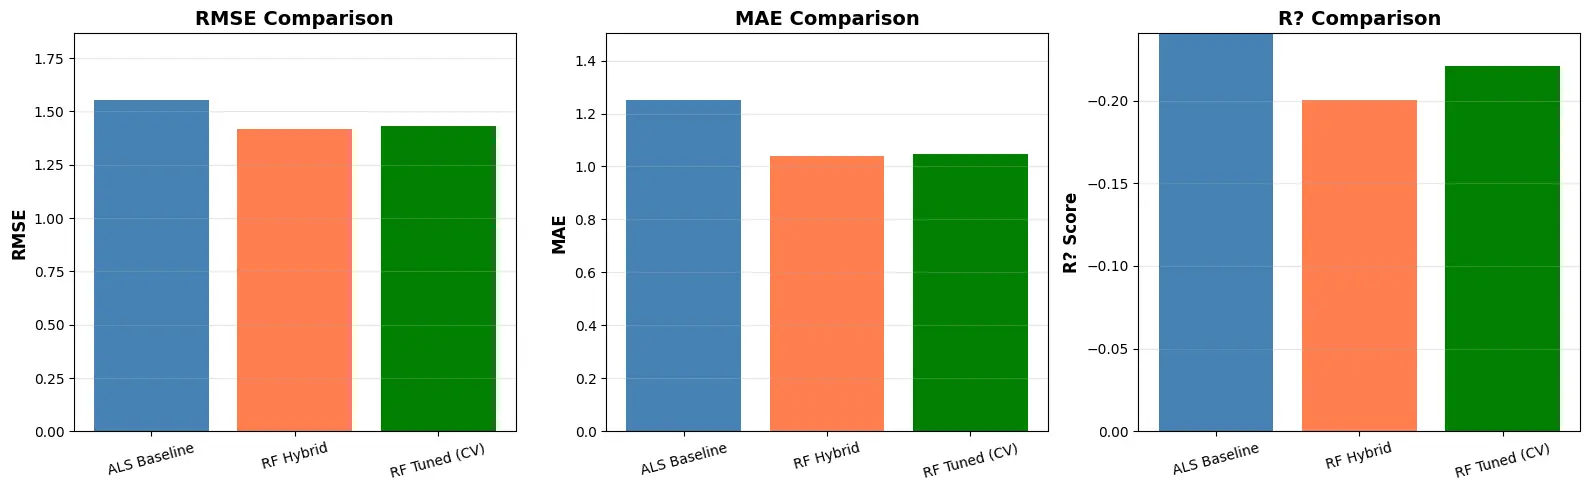
Figure 9: RMSE and MAE comparison between ALS baseline and hybrid Random Forest
Feature Importance (Grouped)
I aggregated the Random Forest feature importances by feature group:
| Feature Group | Importance |
|---|---|
| ALS Prediction | 0.771593 |
| User Avg Stars | 0.124004 |
| Sentiment | 0.053184 |
| Text (TF-IDF) | 0.049451 |
| Category Features | 0.001768 |
Interpretation:
- The ALS prediction dominates (77%), which makes sense because it is already a strong summary of interaction structure
- User average stars is the most important side feature (12%)
- Sentiment and text help modestly (5% each)
- Categories contributed very little in this particular setup (<1%)
This analysis shows that while collaborative filtering is the strongest signal, user history and text-based features provide meaningful additional information.
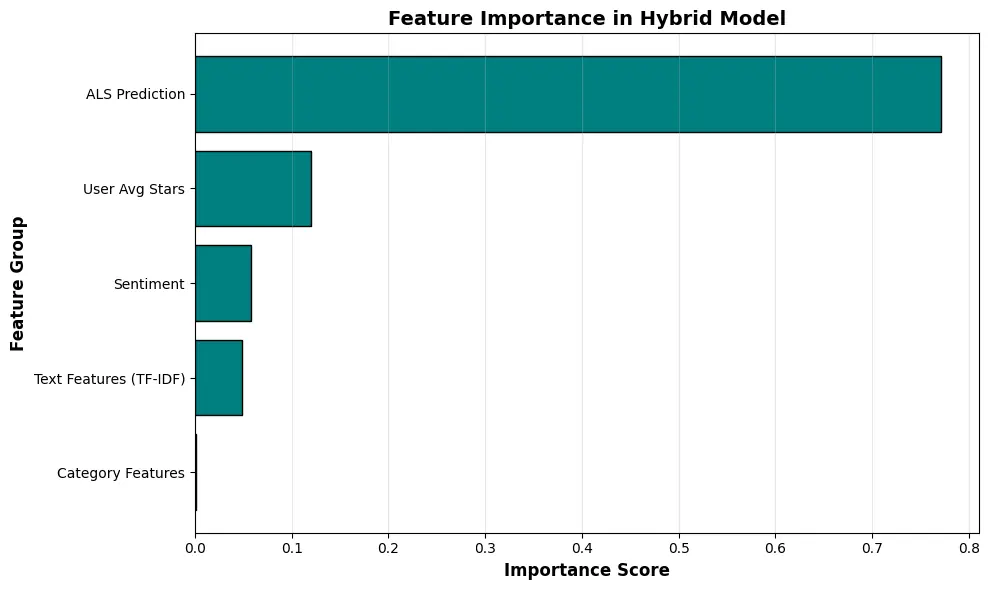
Figure 10: Grouped feature importance for the hybrid Random Forest model
Residual Analysis
I analyzed prediction errors (prediction - actual) on the test set:
- Mean error: -0.0036 (nearly unbiased)
- Std error: 1.4294
- Correlation(predicted, actual): 0.5215
Error patterns by actual rating:
- Actual 4.0 tends to be overpredicted by about 0.86
- Actual 1.0 tends to be underpredicted by about 2.84
This is consistent with the strong class imbalance and rating skew: the model is pulled toward the dominant 5-star ratings.
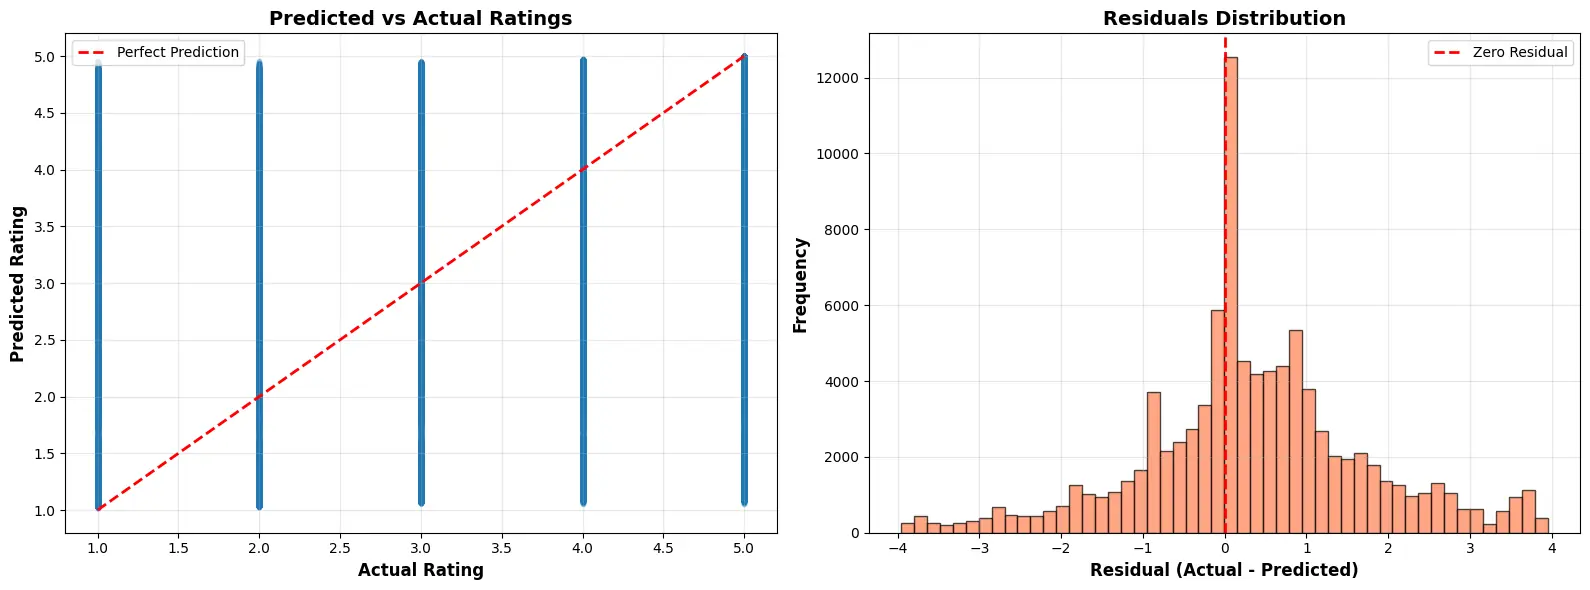
Figure 11: Residual distribution and predicted vs actual scatter plot
Challenges and Solutions
1. Sparsity and long-tail usage
Problem: User-business interaction matrix is extremely sparse with many one-time users
Solution: Activity filtering + iterative 2-core pruning reduced dataset from 1M to 511K reviews while maintaining dense interactions
2. High-dimensional text and categories
Problem: Text and category features can explode to thousands or millions of dimensions
Solution: Hashed TF-IDF into 500 dimensions and limited categories to the top 50, keeping features manageable
3. Model training cost
Problem: Random Forest on 500K+ reviews with 553 features is expensive
Solution: Used Spark for distributed processing, saved Parquet for fast loading, and tuned RF hyperparameters with a smaller sample
4. Ad-hoc exploration at scale
Problem: Need to quickly validate data quality and check intermediate results
Solution: Athena external table over Parquet made SQL queries fast and easy without loading full dataset
Key Insights
What worked well
- Hybrid approach: Combining ALS with side features improved RMSE by 8% and MAE by 16%
- 2-core filtering: Reduced sparsity while maintaining data quality
- Scalable feature engineering: Hashed TF-IDF and limited categories kept features manageable
- Parquet + Athena: Made data exploration and validation fast at scale
Practical applications
- Restaurant recommendations: Predict likely ratings for user-business pairs
- Cold-start handling: User and business features help when interaction history is sparse
- Interpretability: Feature importance shows which signals matter most
- Scalability: Spark-based pipeline can handle much larger datasets
Limitations
- Test RMSE of 1.4292 is still relatively high (target was < 1.0)
- Negative R² indicates room for improvement over simple baseline
- Rating skew toward 5 stars creates prediction bias
- Sentiment analysis is basic lexicon-based approach
Future work
If I extend this project, the highest-impact directions are:
- Richer text modeling: Sentence embeddings or BERT-style features instead of TF-IDF
- Better ranking evaluation: MAP@K, NDCG@K with proper ranking split
- Bias handling: Reweighting or calibration to address 5-star skew
- Time-aware models: Incorporate temporal patterns and review recency
- Location-aware features: Add geographic signals for local businesses
- Deep learning: Neural collaborative filtering or two-tower models
Reproducibility Notes
Language: Python 3.x
Core libraries: PySpark, pandas, numpy, matplotlib, AWS SDK
Environment: AWS SageMaker with Spark
Notebooks:
01_eda_sagemaker.ipynb- EDA and visualizations02_preprocessing_sagemaker.ipynb- Filtering, outlier removal, feature engineering, Parquet export, Athena table setup03_modeling_sagemaker.ipynb- ALS baseline, hybrid RF, evaluation, feature importance, residual analysis
📓 Jupyter Notebook
Want to explore the complete code and run it yourself? Access the full implementation with all three notebooks, detailed methodology, and AWS setup instructions:
The repository includes the complete notebook pipeline, feature engineering code, model training scripts, and evaluation analysis.
Note: This project uses AWS SageMaker and S3. You'll need AWS credentials and a Spark environment to reproduce the full pipeline. The notebooks include detailed setup instructions and architecture diagrams.